
Info: Machine translation This post was machine-translated from the Chinese original. Wording may be rough in places — the Chinese version is authoritative.
Summary All 12 sets are delivered, but repeating the same problem is 15 times worse: long tasks get stuck in the loop outside, not in the model. HyphenTech · M5 Pro 64GB Test · 2026-09-23
At 8:30 a.m. on September 23, I stared blankly at a progress bar. The interface said “average speed 0.4 syphems/sec,” and the fifth round had already generated 3,955 seconds—66 minutes. The same M5 Pro, same Qwen3.8-27B-Splash, the median decoding speed measured the day before was 53.4 syph/s. That’s a difference of over a hundred times.
Later, it turned out: the model had already run out. The server log says 08:30:50 Done · output 1,900 · 32.9 tok/s, fifty-eight seconds of the event. The stream goes silent at the 51st second, and the client waits another 64 minutes. That 0.4 is the fake rate calculated by dividing the number of words by the lag time.
**This is the true form of local long tasks: whether you can finish them depends not on how smart the model is, but on whether the outer loop converges on it. **And that loop is in the application, not in the weight.
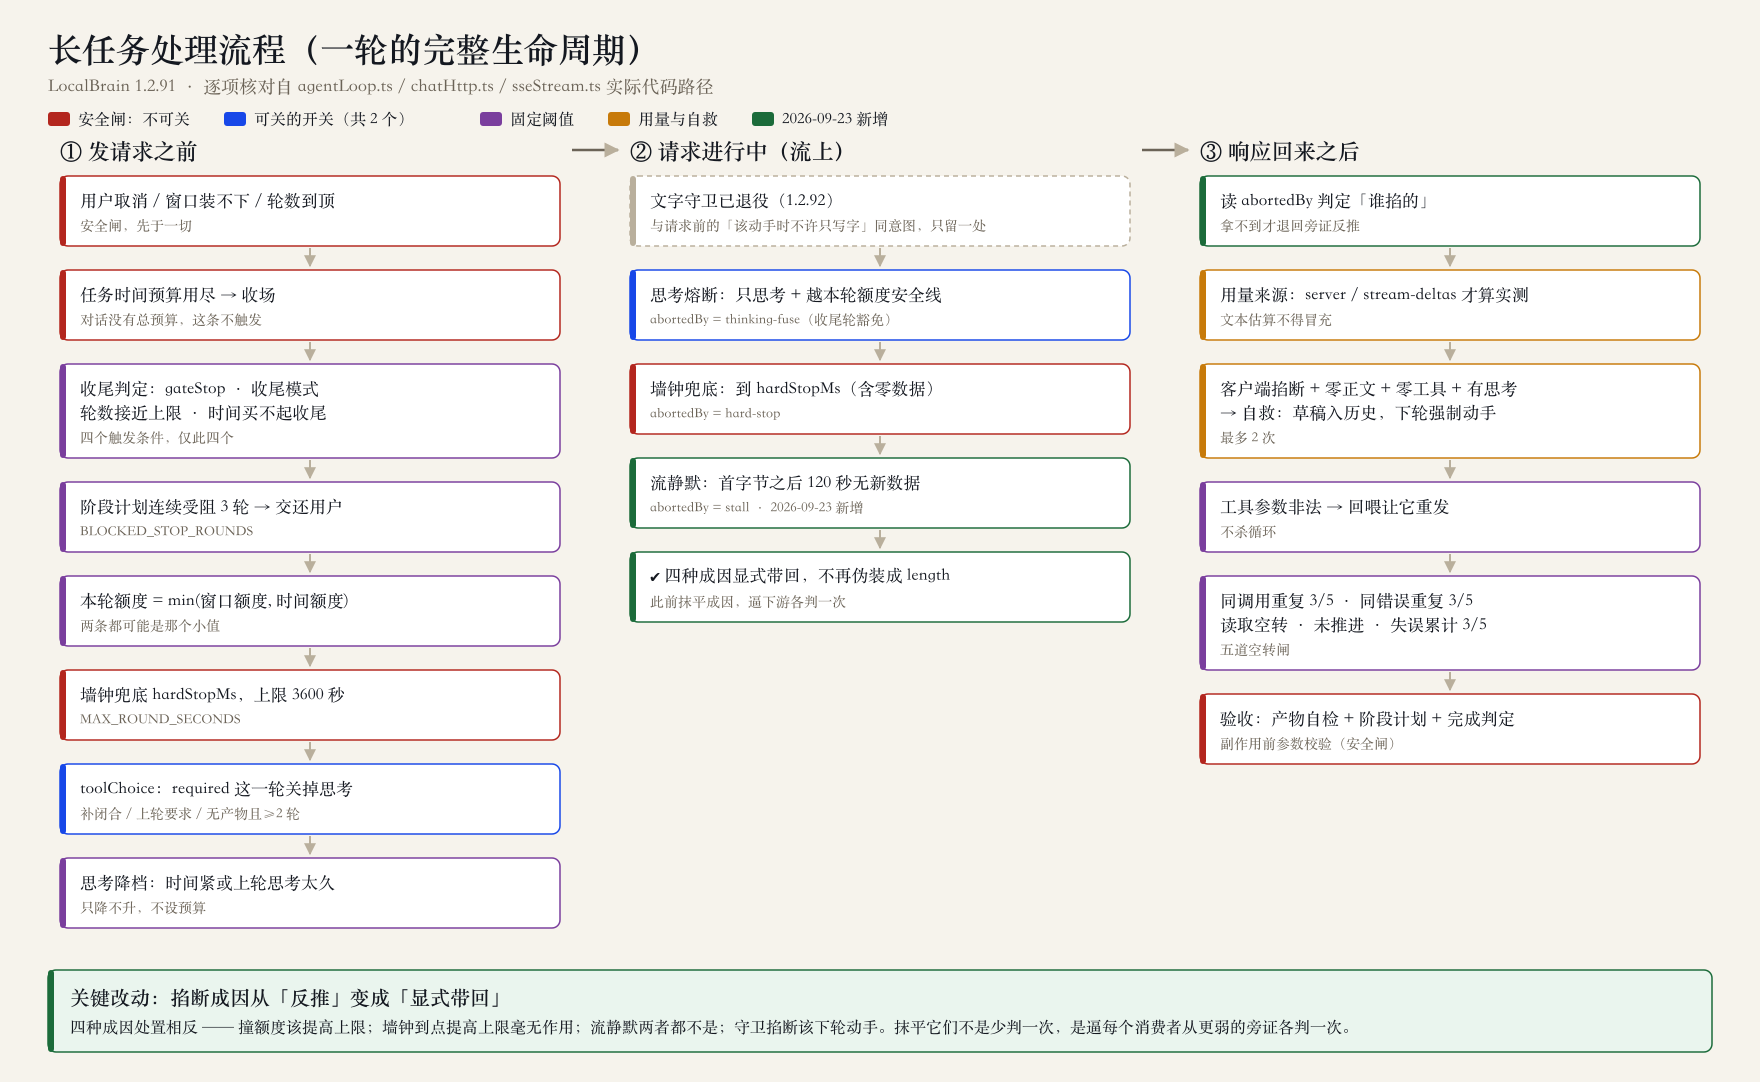
**First, I’ll give you the skeleton. **The next dozen or so sections are repeatedly knocked out, but the things you knock out can be arranged in a chain—from affordable hardware to whether you can finish writing a file, five layers in total. Each layer can block long tasks individually, while most people only focus on the first layer.
| Layer | It determines what it is | Where is the actual stuck-up location on this device? |
|---|---|---|
| (1) Memory | The model size and window length can fit as much as possible | 64GB running 27B, with enough free space to open an 80,000-word window—but this layer is rarely a real bottleneck |
| (2) Speed | How long does one thing take? | Decoding median 27–54 words per second; A round spent 95%–100% of time on generation, not reading history |
| (3) Quota | How much can be written in this round? | min(window remains, rate × single round duration); After about 567 seconds, your time lags into an output hardtop |
| (4) Parameters | Does the configuration match the model? | One set calculated a budget of 4B runs 27B—the losses on this floor are greater than the combined total of the previous three floors |
| (5) Mechanism | Will loops converge on behalf of the model? | No one cares when the stream goes silent, the client waits 64 minutes; The judgment is too loose, and round 33 is still stuck in place |
The first four layers are physics and arithmetic, and the fifth is software writing. What really determines whether long tasks can be delivered is usually the final layer
This section is the table of contents, not the conclusion. If you want to read the full deduction directly, jump to the section at the end of the article titled “What exactly gets stuck in local deployment?” If you want to know why I ran into them, just read down in order.
First, let’s clarify what the ‘loop loop’ is
You have the model become a snake that can run in the browser. It can’t spit everything out at once: read the environment, come up with solutions, write files, run self-checks, check errors, and revert to it. Each “think + do” cycle is one round, and one task can be many rounds.
The work of the cycle is to make judgments before and after each round: should it be forced to act this round? Is it just spinning in place? Is the quota still sufficient? When should it stop to report? These judgments add up to about thirteen points, distributed across three locations—before the request, in progress, and after the response is returned. The diagram above shows the full picture.
To put it in a somewhat accurate but easy-to-understand analogy: the model is the chef, and the cycle is the kitchen manager. The chef’s skills are fine, but he might spend forty minutes figuring out the plating, might remake the same dish five times, or refuse to serve it when the dishes are ready. The manager doesn’t cook; he only interjects in those moments.
Breaking it down: three configurations, twelve sets of tasks
Four questions from simple to complex—countdown clock, bouncy ball, gluttonous snake, brick breaking; Three configurations: All current gates (strict), only relaxed value thresholds (moderate), and two switches turned off (relaxed). Each compartment records the number of turns, wall clock seconds, bytes of products, and final self-check.
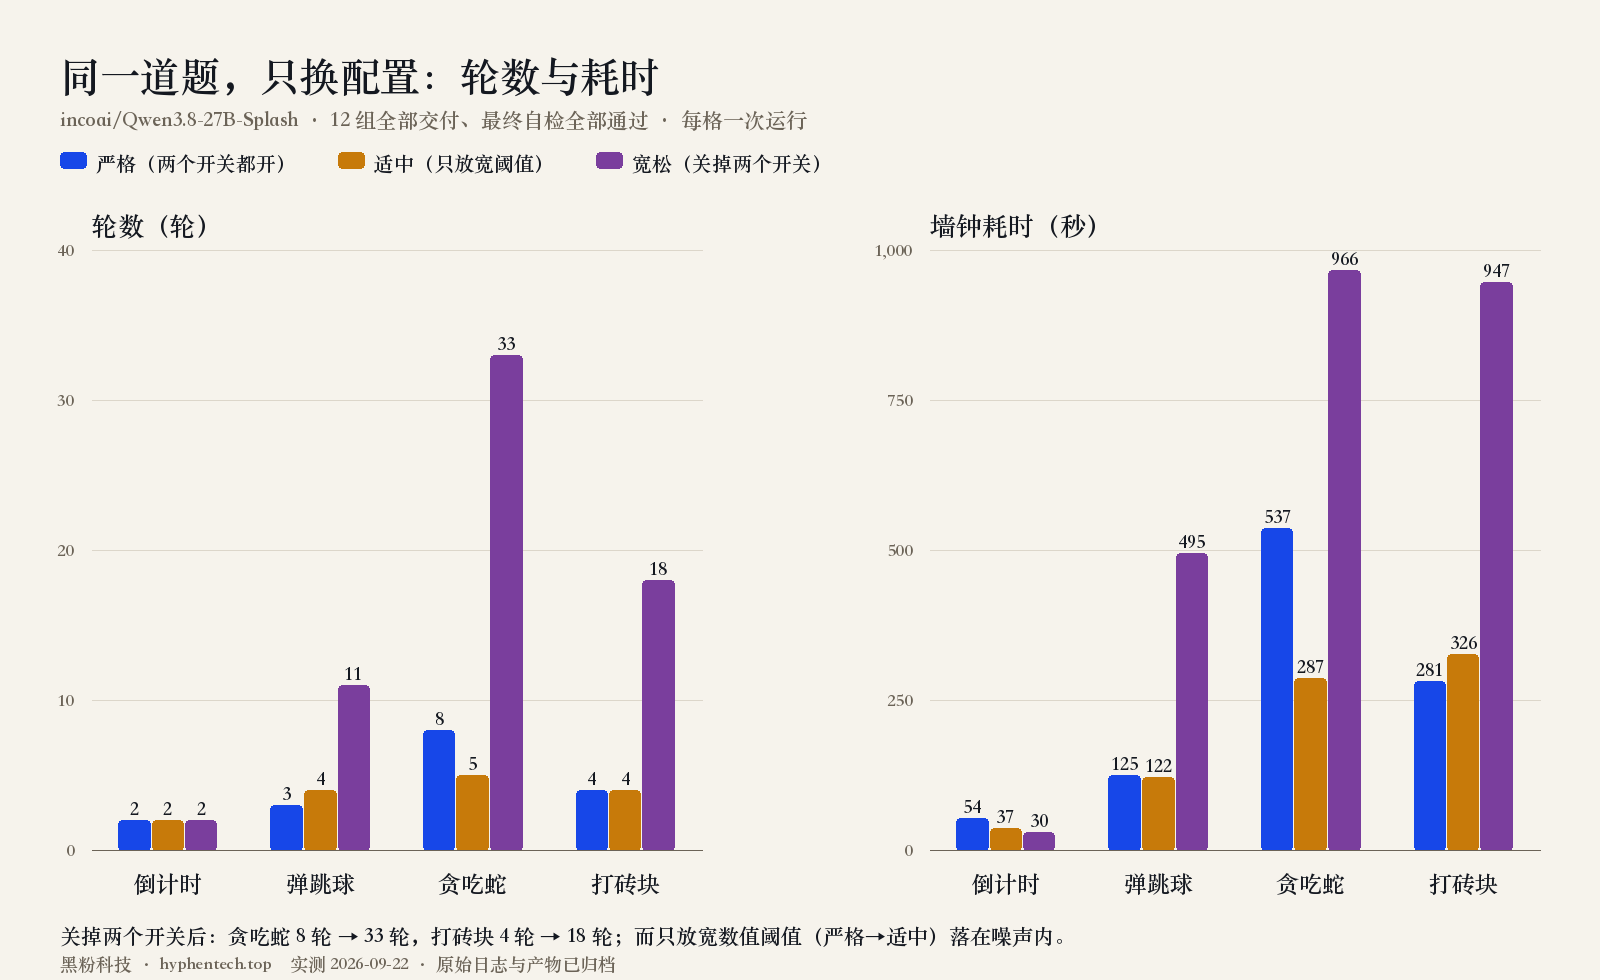
All twelve groups were delivered, and in the end, eleven groups passed the self-inspection. When I saw this form, my first reaction was ‘best among moderate’, but that judgment was wrong, so I took it back—the reason will be explained in the next section.
But hidden behind it is a clean natural experiment. Strict to moderate, I only changed the numerical threshold (several consecutive mistakes count as idle, relaxed from 3/5 to 5/8, etc.), left two switches unturned off, resulting in noise levels. From moderate to relaxed, while the threshold was relaxed again, two switches were turned off, total rounds increased from 15 to 64.
**Numerical thresholds are almost ineffective; switches are decisive. **
By the way, for comparison: these 12 groups sent 110 requests to Splash, with decoding speeds of 31.6 at the lowest and 53.4 in the median, and 90.3 words per second at the highest. **The speed has always been steady, so steady that it can’t explain the difference between 17 and 64 rounds. **
The two switches are: Forcing tool calls when no product is present, and Thinking only, disconnecting midway when zero output.
The little opening time saved by the relaxed tier is listed elsewhere:
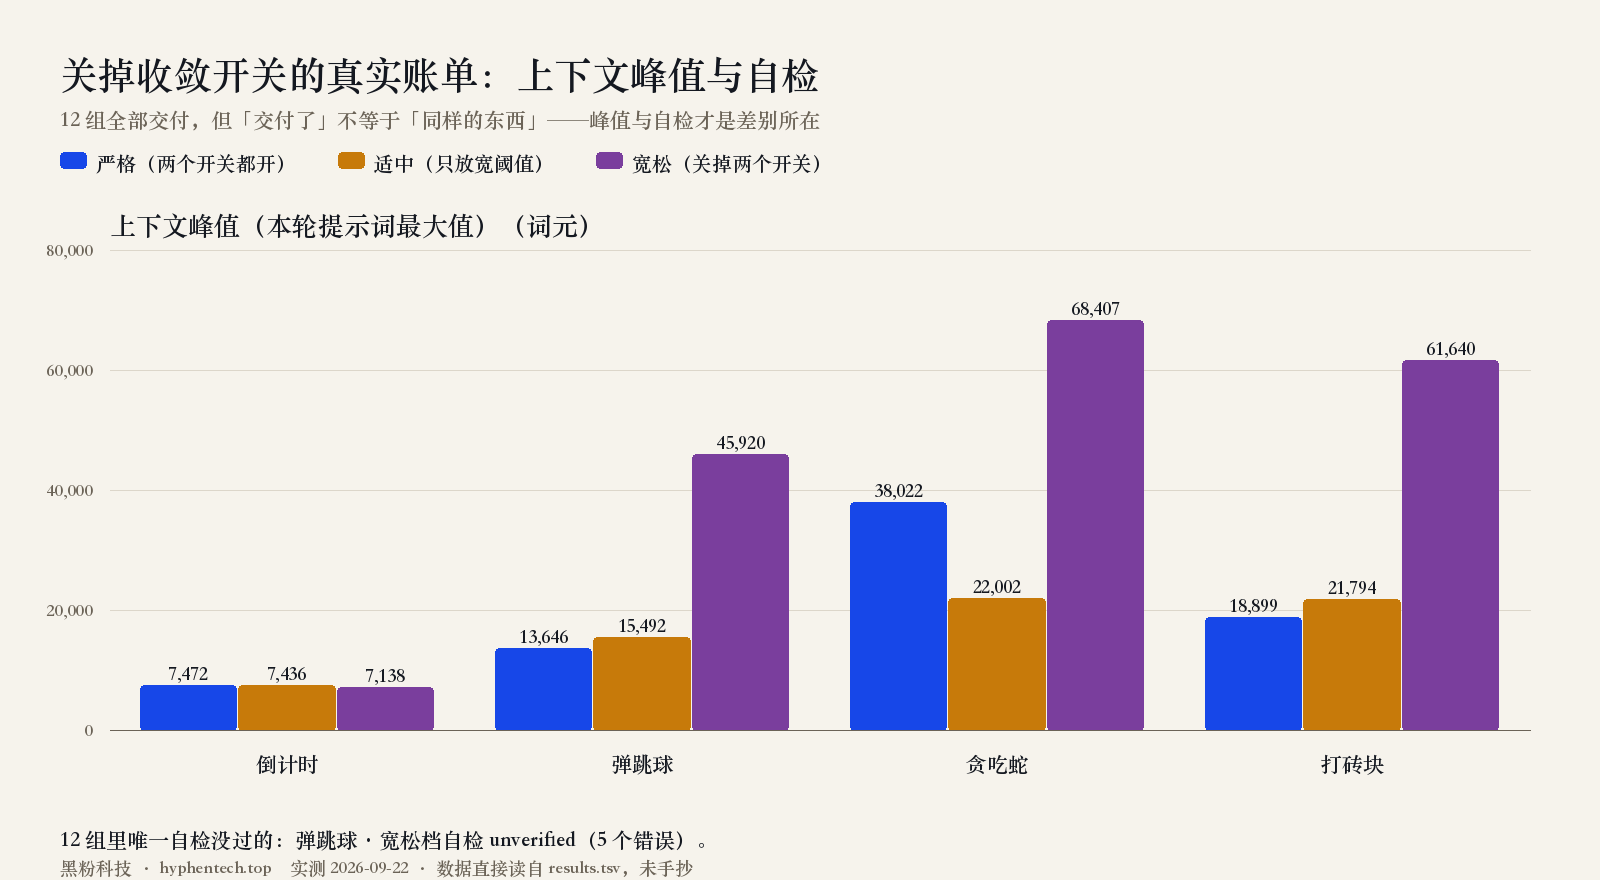
In the Snake group, the peak context value rose from 38,022 words to 68,407, nearly doubling. The brick-breaking group rose from 18,899 to 61,640. And the only thing in the twelve groups that failed the self-check was the loose range’s bouncy ball—unverified, five errors. “All delivered” and “delivered the same thing” are two different things.
The hardest part isn’t parameter tuning, but distinguishing noise
This is the section I want to focus on.
Same problem, same machine, same set of parameters, Ling-3.0-tiny ran three times: 5 / 12 / 39 rounds, 88 / 270 / 1,346 seconds. Nothing changed, rounds differed by 7.8 times, time difference was 15.3 times.
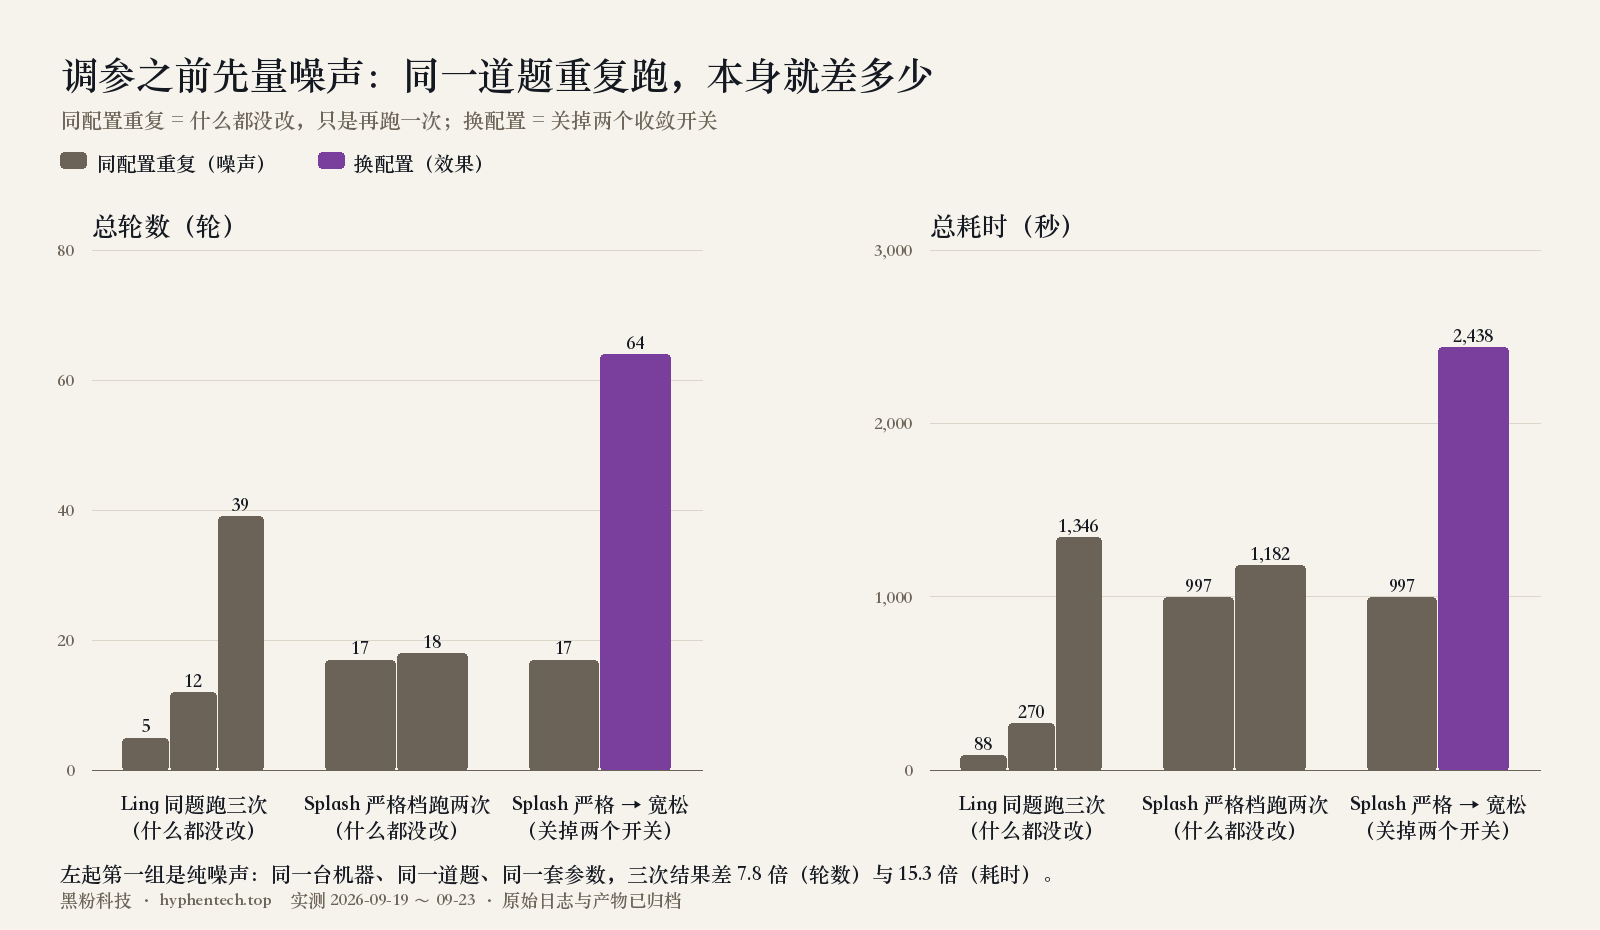
If you compare the first group on the left (pure noise) and the third group on the right (real effects) side by side, the conclusion is glaring: **At this noise level, saying ‘this spec is better’ after running once is actually just luck. **
On September 23, I redid the strict four-bar set to see if a fix had improved it. The result was 17 rounds in 997 seconds → 18 rounds in 1,182 seconds. It looks like a 19% regression, but it doesn’t really mean anything—it just fell into the noise. The real value of this rerun was the regression check: confirming that the fix didn’t break the path that was already walkable.
The cost is real. To distinguish a real difference over a 15x span, you need more than a single digit of repeats; And each repeat on the machine is a wall clock of several to dozens of minutes—these 12 sets run for 4,207 seconds, nearly seventy minutes, and it’s just once per grid. “Adjusting parameters” sounds like a ten-minute thing, but in reality, it’s a whole day.
That’s also why I didn’t make the numerical threshold adjustable in the end. Not because it’s unimportant, but because letting users try a value at 15x noise is passing impossible tasks onto them.
Back then, the debate between -O2 and -O3 lasted for many years, largely because the noise in benchmark tests was close to the gap between the two, and everyone only ran once. Noise eats away at the effect, and the conclusion becomes faith.
Key options: What each person is responsible for, and what happens if they turn it off
The table below is organized by ‘What can you change on the interface?’ The advantages and disadvantages are based on local testing, not speculation.
| Options | Default | Function | The benefits of raising or opening up | The cost of raising/opening |
|---|---|---|---|---|
| Single output cap | Automatic | What is the maximum number of words generated in one round (including thinking and tool parameters)? | Complex products can be written in one go, reducing several rounds of back-and-forth | Thinking is also within this limit—the bigger it is, the easier it is for it to be eaten up by it |
| Single round duration limit | 180 seconds | A single-wheel wall clock is at the bottom, with a maximum speed of 3,600 seconds | Slow machines are not cut off prematurely | If you set it too wide, a single flying round will take a long time to stop |
| Tool agent turns | Automatic | Each task can take up to several rounds | Complex tasks have room for repeated revision | If you don’t hold back, only finish off the time you drag it out |
| Intensity of thinking | Automatic | Give the model a share of the budget for consideration | Difficult problem planning is more stable | Local templates often treat budget as a suggestion, with tiers ≠ strict constraints |
| When it’s time to do something, don’t just write it | Open | If you have two rounds without product, forcibly call the tool and turn off this round of thinking | Avoid constantly describing plans without placing a plan | After turning it off, test: Bouncing ball performed 8 consecutive rounds of self-check, 400 seconds |
| Only thinking about zero output and cutting off halfway | Open | One round only involves thinking, and if you cross the limit safety line, the request will end early | Don’t let one round burn the entire quota into thought | After turning it off, the test was: one round burned 32,768 syllables, 11 minutes, zero output |
| Contextual history limit | 24 entries / 12,288 word characters | How much history will you bring to the next round? | The model remembers earlier decisions | The peak price directly pushes higher, and the longer it lasts, the slower it gets, the more expensive it gets |
| Automatic connection when cut-off | Open | When hitting the limit, the generated content will automatically continue with the generated content | Long answers don’t break in half | You can renew up to 4 segments; if you can’t finish, it’s still interrupted |
| Contextual memory budget | 50% | Proportion of remaining memory allocated to KV cache (adjustable from 1.2.100, 30%–85%) | This directly brings a larger context window | Less allowance for calculation buffers and runtime fluctuations; Allocation failures will automatically roll back |
**Both switches are on by default, which is the behavior before the switch is added. **I haven’t revealed the numerical threshold to users—tests show that adjusting it has no observable effect, and a useless knob only makes people think they’re controlling something.
This scenario had already been played out with database query planners: the parameter adjustment manual was as thick as a brick, and the real effect was usually just a few switches; the rest of the knobs were more reassuring. The difference was that the planner had statistical data to rely on, but here it didn’t—the generation process was different every time.
I’m not sure about the part
I added these gates one by one, and every one felt perfectly natural. On September 23, I checked each item and found three different variants of the same disease: **The client’s own interrupted request looked exactly like ‘True Failure’ on the consumer side. **
Text guard, thought circuit breaker, wall clock as backup—after all three are stopped, the reason for the termination of synthesis is ‘length’, which is indistinguishable from real collision limits. The code even specifically stated the reason: ‘It’s not worth distinguishing a third state and each consumer should be judged once.’ Today’s statement was overturned in actual tests—the four causes are opposite: the collision limit should be raised; the wall clock at point raising the limit has no effect; the flow silence is neither; the guard cutting off should be the next round of forced action. The reason for smoothing out isn’t one less penalty, but forcing each consumer to be judged once based on weaker corroborating, and two wrong judgments have already been made.
What’s even more embarrassing is the third point: when the client doesn’t get the server’s usage, it estimates a number based on the text length, erasing the “Did you get the usage” signal—and the first two repairs rely precisely on this signal. **The third part will disable the first two points together. **
As for the first 64 minutes: the line of code for reading streams can never return. At the time, I thought there was a catch-all, but the comment said ‘Pocketed by undici’s bodyTimeout.’ Neither of these points holds—this option was never configured in the project, and the request ran in WKWebView, not using undici at all. Silent streams had zero constraints at the time.
All of this has now been fixed: the cause was changed to explicit reinforcement, and the read stream added a total time limit and a 120-second silence after the first byte. I conducted regression tests for both of these areas—short-circuiting the time limit logic, causing the test to crash and timeout; After restoring, everything went green. But I wouldn’t dare say there was no fourth time.
Back then, web compatibility was the same situation: pages didn’t work, not because the browser wasn’t strong enough, but because something was missing to smooth out the differences. The difference was that the differences back then could be listed in a single table, but the model’s failure patterns couldn’t be fully listed—today, these three points each failed in real tasks before I saw them.
Later: the fourth part was there, and one of them I missed myself
The day after I finished writing the line above, ‘I dare not say there is no fourth place,’ I checked the entire chain again using the same method.
** First, let’s talk about the ugliest one. ** I listed four ‘never triggered, can be deleted’ mechanisms. When I tried deleting them, three out of four were wrong:
| Candidate | The result | Why? |
|---|---|---|
| Text guard | Deleted | Twelve citations → 0 are indeed the same as ‘do not just write when necessary.’ |
| Collision limit cut-off feedback | Rescue | The fingerprint was written incorrectly. The real fingerprint triggered 9 times out of 103 runs |
| The air response gate was used | Rescue | 6 lines long, 1 citation. It’s a safety net, not a complexity |
| Repeated invocation of blockade | Rescue | Changed to ‘Block All’ and ended up with 5 tests, one of which was called ‘Error Limit is the Last Line of Defense’ |
The pattern for three errors is exactly the same: Treat ‘trigger 0’ as ‘worthless’. And that zero has two sources—fingerprint search error, and it was originally a safety net (nothing was guarded, so zero is found). What’s even more embarrassing is that the first section of my own verification document says ‘never triggered doesn’t mean it’s worthless,’ and then deleted it by trigger count. **Writing down rules doesn’t mean they’ll enforce them. **
**The second is that the status wasn’t recorded. ** There were 22 local variables in that loop that determined behavior, but only 8 were stored at the checkpoints. Out of 103 runs, 25 actually recovered from the checkpoint—after recovery, the counters for ‘how many more times can it save itself after the circuit breaker’ and ‘several consecutive rounds without progress’ both start from zero.
The point is not that “these 14 are all bugs.” The round budget reset is intentional, with a line in the code dedicated to guarding; the other two are no one has ever decided. The current situation is: it’s hard to tell which resets are design and which are leaks, because no intention is recorded anywhere.
**The third point was my own misunderstanding, and I made it twice. ** Someone asked me, ‘Can’t compressing before the context limit solve the problem?’ I answered twice ‘Automatically fold and default is closed.’ After checking the code, I found that compression actually has three layers, and the middle layer stays open: when the normal work budget is tight, the program will send a special request without tools to make a summary or replace history, and verify that the summary is indeed large and small before adopting it.
Why did I miss it? Because I searched for ‘fold’, and in the code this path is called ‘Transfer’. **Search terms are anchored to implementation terms, not semantics. **The same bug caused me to mistake log fingerprints seven times in the past two days.
There was still memory, so why was the context full?
Following this question, I found a solid parameter. Local 64 GB, model resident 33.3 GB; after deducting 6 GB reserved by the system and 3 GB reserved by the app, 21.7 GB remains. But only 10.85 GB is actually stored in the KV cache—because the formula says “the remaining half” is locked down. The other 10.85 GB just sits idle.
This spec is true, but I misconnected it to another thing at the time. The window displayed on the interface was 81,920. I casually explained it with this formula: 10.85 GB per syllable is 139 KB, which is just over 80,000 km. **If the numbers match, the cause and effect is wrong. **
 can actually be contextualized.
The remaining half isn’t wasted: calculation buffers, resident estimation errors, and runtime fluctuations all come from it. But 0.50 is a conservative default, not the best in actual tests, and the source code doesn’t explain why it’s 0.50. So starting from 1.2.100, it was opened to adjustable (30%–85%, default unchanged). By local estimates, for a GGUF model running llama.cpp, setting it to 65% can push the window to just over 100,000—this slider can’t handle Splash, and the reason will be explained in the next section.
Raising is not free, but there is a self-healing guarantee: failure in allocation is recorded, and next time it automatically drops to two-thirds of the failure value.
A month later, I realized this explanation was a coincidence
On September 24, I re-examined this and took out that in-memory formula and ran it once: fed into Splash’s real parameters, and it returned null—never executed. Splash’s model package didn’t have config.json, couldn’t read the KV overhead per word, and the formula lacked necessary input, so I gave up on it.
81,920 from elsewhere: a line of dead back-and-forth constants, with the note ‘Only for old GGUF to rollback when metadata is missing.’ Splash is not a GGUF, nor does it lack metadata; it just isn’t recognized—the program is looking for the llama.cpp’s startup parameters --ctx-size and /props interfaces, while Splash has neither, so it just falls into the bottom line.
And that memory formula calculated with the same input is 80,896. That’s 1,024 less than 81,920.
This tiny difference is the hardest kind of difference to detect. If it were twice as bad, I would look it up the same day; But it fits perfectly, so I treat a constant as the calculation result and even write it into the paper. **Being able to explain doesn’t mean it’s the reason. **
The real window has always been there: Splash himself announces /status maximum_context_tokens: 262144, but we never asked about it. 1.3.5 After switching to reading this number, the memory budget on the same machine increased from 61,440 to 196,608, and the number of retained entries increased from 64 to 96.
It’s worth mentioning that this is already the second time on the same line. In version 1.2.44, I also received comments like “There’s still some memory left, are the parameters too conservative?” That time, the conclusion was to replace the old 20%+20%+55% with the current unified reserved model. **When a parameter is asked about a second time, it usually means it should be given to the user, rather than adjusting the default value again. **
The real culprit: a group with a budget calculated at 4B, running 27B
All the issues I found earlier were mechanical flaws. But what really made me feel this month that “local models can’t handle long tasks” is something even stupider.
On September 24, I dug up the same problem — making a single-file HTML game with gathering, building, combat, and win-loss — and checked it again. I ran through this problem intermittently 17 times, not even once.
Let’s first look at how these 17 episodes ended:
| Reasons for stopping | Times |
|---|---|
| “Stopped this round of mission as requested” = I personally pressed the stop button | 11 |
| Maximum single-hit damage output | 2 |
| No push gate / Read the idle turnstile | 2 |
| No records | 2 |
Two-thirds of those were my own choices. And the few times the mechanism was truly ruled dead, the reason was the same:
本轮实际生成 2,185 词元(单次上限 2,185),已用完但尚未开始正文或有效工具调用
** Single run limit is 2,185 words. ** A single game of this type can run at least tens of thousands of words, and this amount can’t even cover the beginning. Each round of the model is cut off, the product remains unchanged, and without pushing the gate, it is finally declared idle—it looks like “model is bad,” but in reality, it doesn’t even get a chance to fully express itself.
And in these 17 cases, context was not a bottleneck: 0 context folds, 0 summary transitions, and the 256K window on the model side was used at most 16%.
I narrowed this sentence later. The actual input limit sent to the model in the loop is not 256K, but the 81,920 minus the reserved 61,440. On September 24, when running a 3D construction problem, the remaining window for round 19 was only 5,973—7%, and the model started rereading the same file repeatedly. So to be precise: in these 17 rounds, it wasn’t a bottleneck, nor was it ‘never’ (never).
In the end, the reason was uncomfortably dumb: **The model selected in the interface was a small 4B model, but all 17 runs were 27B. ** Automatic optimization planned budget according to the selected 4B, gave 单次输出 6,144 / 上下文 24,576, and rewrote every startup — I manually changed the major overall, and upon reboot it was overwritten again. At the time, I thought I had remembered wrong.
After replacing the selected model with the one actually running, the same set of automatic optimization calculates 16,384 / 61,440.
One-variable control: For the same model, only the single round duration was changed from 180 seconds to 600 seconds
After fixing the parameters, I did a comparison; except for the single round duration, everything remained unchanged:
| 180 seconds | 600 seconds | |
|---|---|---|
| The result | Draft · Self-check Not Passed | Delivered · Self-inspection passed |
| Interactive checks | Four items were not passed | All 12 items passed, 864 animation frames |
| Number of rounds | 11 | 6 |
| Time-consuming | 710 seconds | 783 seconds |
| The whole round is spinning idly (cut off by thoughts) | 5 times | 1 time |
Spending an extra 73 seconds means going from an “unverified draft” to “delivered and fully self-checked.”

The key isn’t the wall clock. The limit on single round duration is the output amount it converts (actual speed × seconds): 600 seconds to get about 25,000 words in the first round, finishing the entire file in one go — that round actually took 374 seconds; 180 seconds was only about 7,700, so it was unfinished, and the remaining ten rounds were patched.
What is saved is not time, but waste.
Control group: The same model is given to another set of schedulers
To confirm this wasn’t just “the model happened to be in good condition this time,” I ran the same model and the same problem with another open-source agent scheduling framework, aligning endpoints, limits, and permissions all together:
| Quota | Time-consuming | Product | |
|---|---|---|---|
| Another Dispatch · The first time | 8,192 | 248 seconds | 0 (I didn’t open the tool to approve, mistake) |
| Another Dispatch · The second time | 8,192 | 221 seconds | 0 (Only gave a quarter of the quota, and it was my mistake again) |
| Another Dispatch · Third Time | 32,768 | 843 seconds | 0 (still 0 after alignment) |
| This article is about this set | 32,768 | 783 seconds | 411 lines, self-check passed |
The third time was fair comparison: quadrupled the quota, gave 60 extra seconds, but still didn’t write a single file. The output of 100,000 bytes never left the inference from start to finish, and at the end they were still discussing how to define an auxiliary function.
The difference lies in the previous two gates: one round with zero output thinking and then interrupted, and consecutive no-output means turning off thinking and forcing tool call. The 180-second group saved five rounds with them.
This also corrected my own judgment: the first two controls failed very thoroughly (with zero output), which I once considered strong evidence, but later realized that both times I had paired the control group with a cripple. **The more the control group’s results matched expectations, the more you should first check whether it had even run away. **
⚡ Why is Splash fast: The draft model has changed three generations
Previously, we kept saying “the loop outside loops,” but the speed layer itself is also changing. The Splash running on this machine has a decoding median of 53 sygmph/s, while the same 27B parameter llama.cpp only 9.11 sygmphs per second. **Among the missing parts, one piece is not given by quantization bit width, but by decoding method change. **
Let’s start with the basics: speculative decoding. A small draft model guesses a string of words, and the target model validates the entire sequence of words forward-forward**. If it gets right, it gets several at once; if it guesses wrong, it discards and starts over. The key is—every word you produce is verified by the target model, so the result of greedy decoding is identical to non-speculative word-for-word, and the sampling maintains the original distribution. This isn’t ‘trading speed for small models’, but acceleration without trading quality.
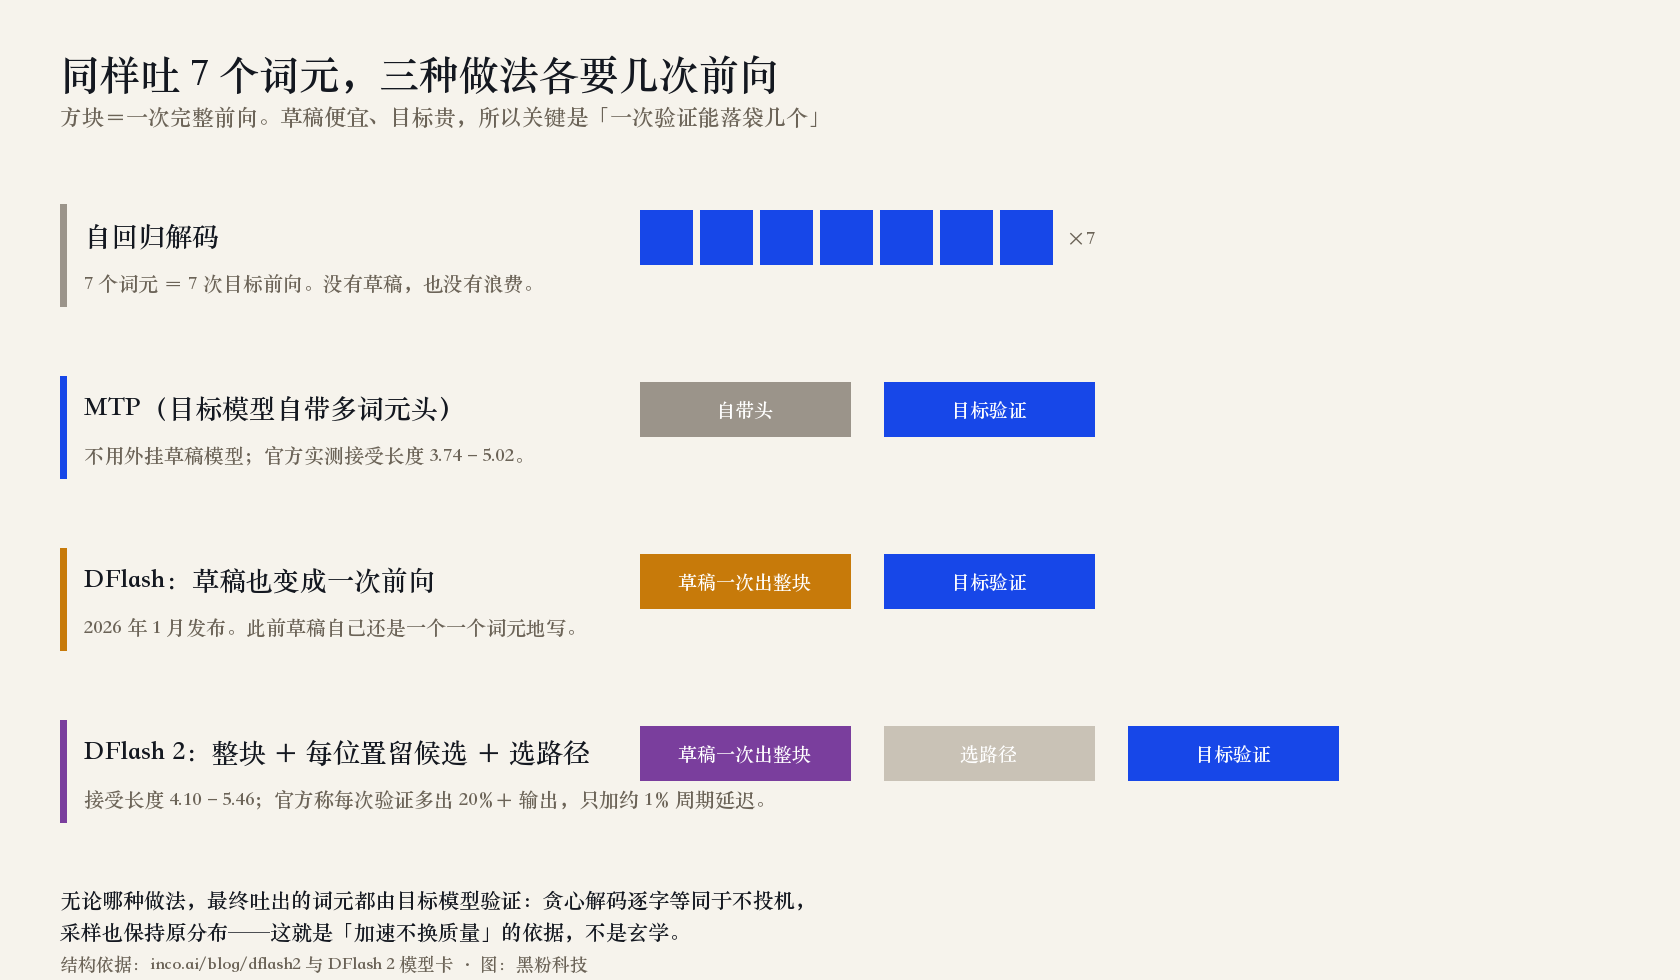
The difference among the three generations lies on the other side of the draft:
- MTP (Multi-word Prediction): No external draft model, uses the target model’s built-in multi-word prediction to predict several candidates for the first time. Qwen 3.8 comes with a seven-word MTP, official test acceptance length 3.74–5.02.
- DFlash (January 2026): Before this, the draft model itself was still autoregressive—writing word by word one by one. DFlash also turns the draft into a forward one: predicting all positions in the block in parallel.
- DFlash 2 (August 2026): The official statement is very straightforward—each position predicts independently, leaving margin at two points: Select the correct word token and maintain accuracy all the way to the end of the block. DFlash 2 fills the first spot with “leaving multiple candidates at each position + a lightweight selector picking out a coherent path,” and uses two-tap dynamic convolution in the trunk to fill the second position. The cost is about 1% cycle delay, and the benefit is over 20% more output per validation.
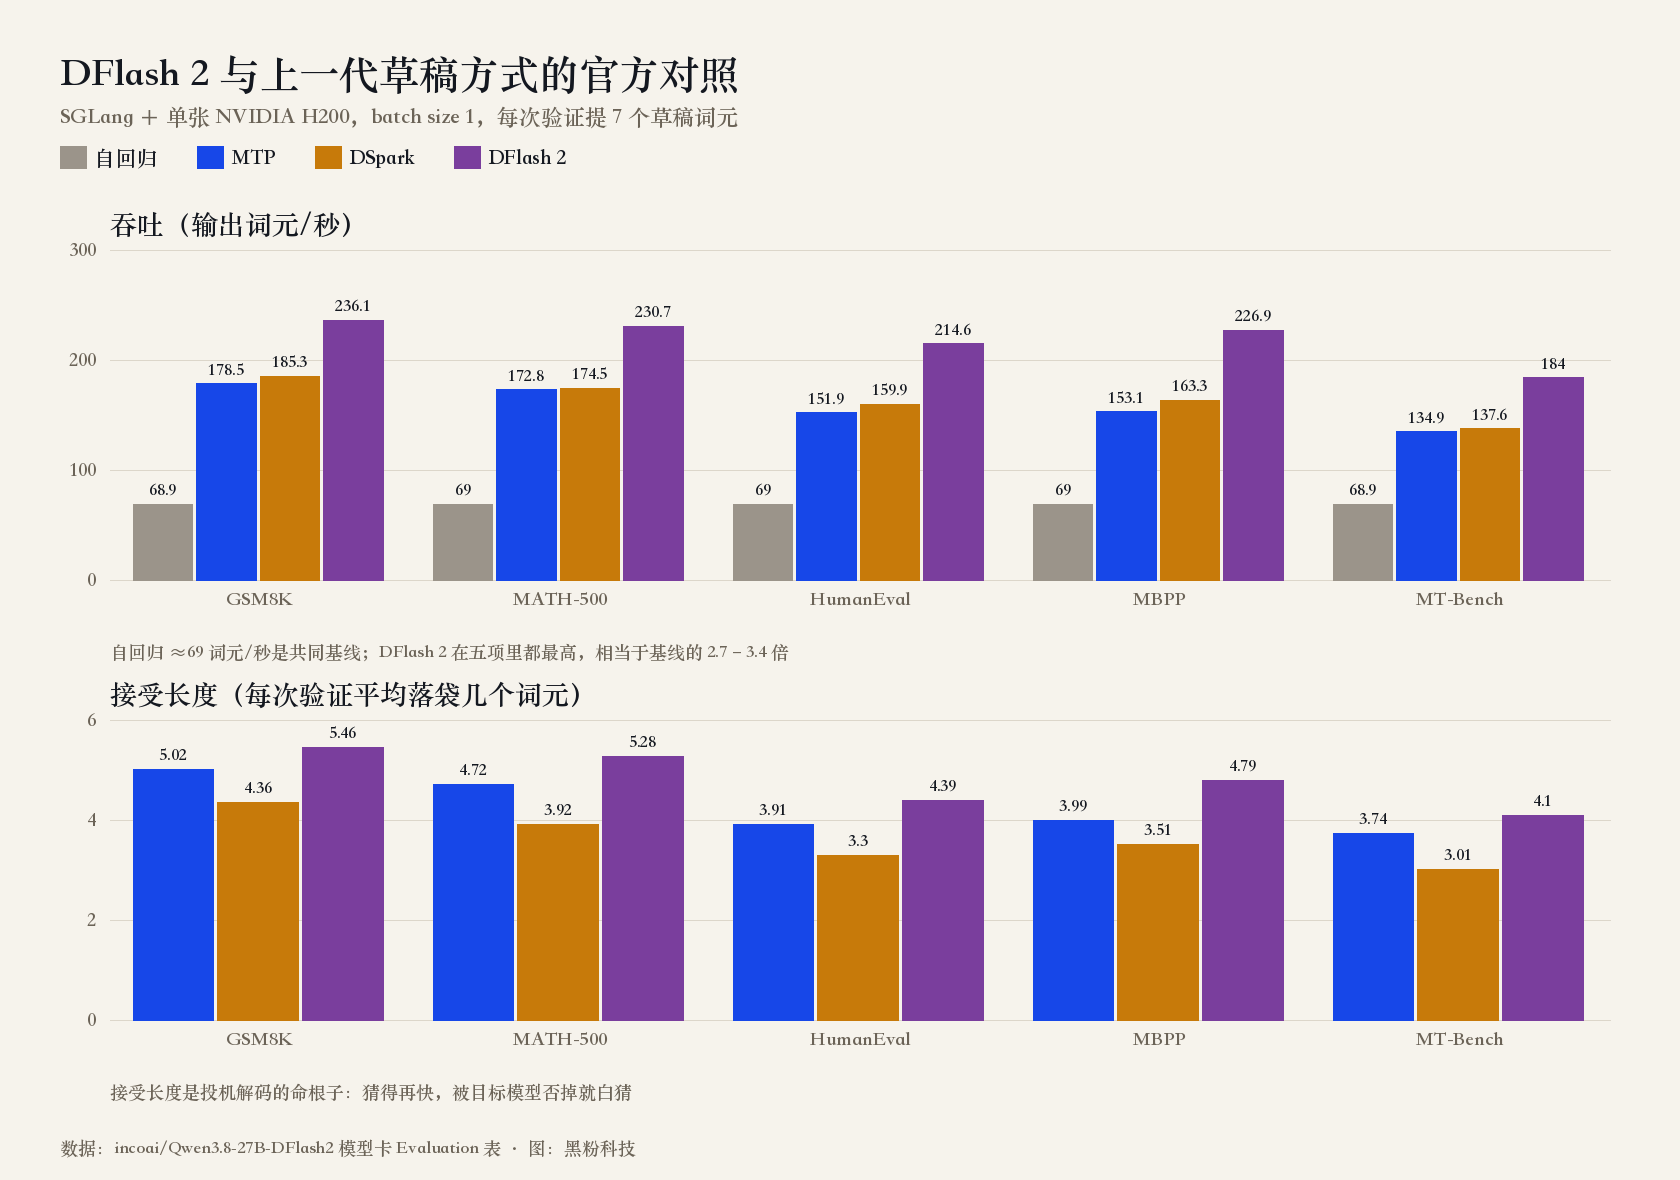
Read these two tables thinly: **Acceptance length is the lifeblood of speculative decoding. **No matter how fast you guess, if the target model rejects it, it’s basically a pointless guess. DFlash 2 pushed the acceptance length from MTP’s 3.74–5.02 to 4.10–5.46, so on the same hardware, throughput changed from an autoregressive 69 words per second to 184–236, which is the official 2.7–3.4 times higher.
Splash is the engine that brings this system onto Apple chips (Inco AI open source, brew install incoai/tap/splash). The native incoai/Qwen3.8-27B-Splash isn’t a regular weight package; it contains four things: a 4-bit target model, its DFlash 2 draft model, a visual encoder, and a tokenizer—which can only be loaded in Splash, and MLX and Transformers can’t be opened. The entry requirements are M3 or above, macOS 26.4 or above, and 36 GB of unified memory (officially recommended at least 48 GB).
Warning **Don’t transfer those multiples to your own machine. **Those are the numbers for H200 + SGLang, while this unit is M5 Pro + Metal, totally on a completely different scale. And in my setup, the speed difference between Splash and llama.cpp is mixed with quantized bit width (4-bit main model vs Q8_0), so this experiment can’t be separated from which part is due to speculative decoding. To split it down, you have to run another set of llama.cpp 4-bit 27B for comparison—I haven’t run it yet.
📒 A real request ledger: what I did with it myself
The data above is from the desktop rack. This section is my own daily usage record—LocalBrain records every model call in the local ledger: which model, how big the prompt, how many words were written, how fast, and how it ended. Taking the segment from the evening of September 24 to the afternoon of September 25, 200 requests, 187 completions, only two models were involved, both using Splash.
Let’s look at the items first: the nine documents I have completed during this period
The numbers in the ledger eventually became concrete things. The next eight images are actual running screenshots—all single HTML files, open in the browser with a double click: no build steps, no npm, no backend, and not a single piece of code I wrote myself.
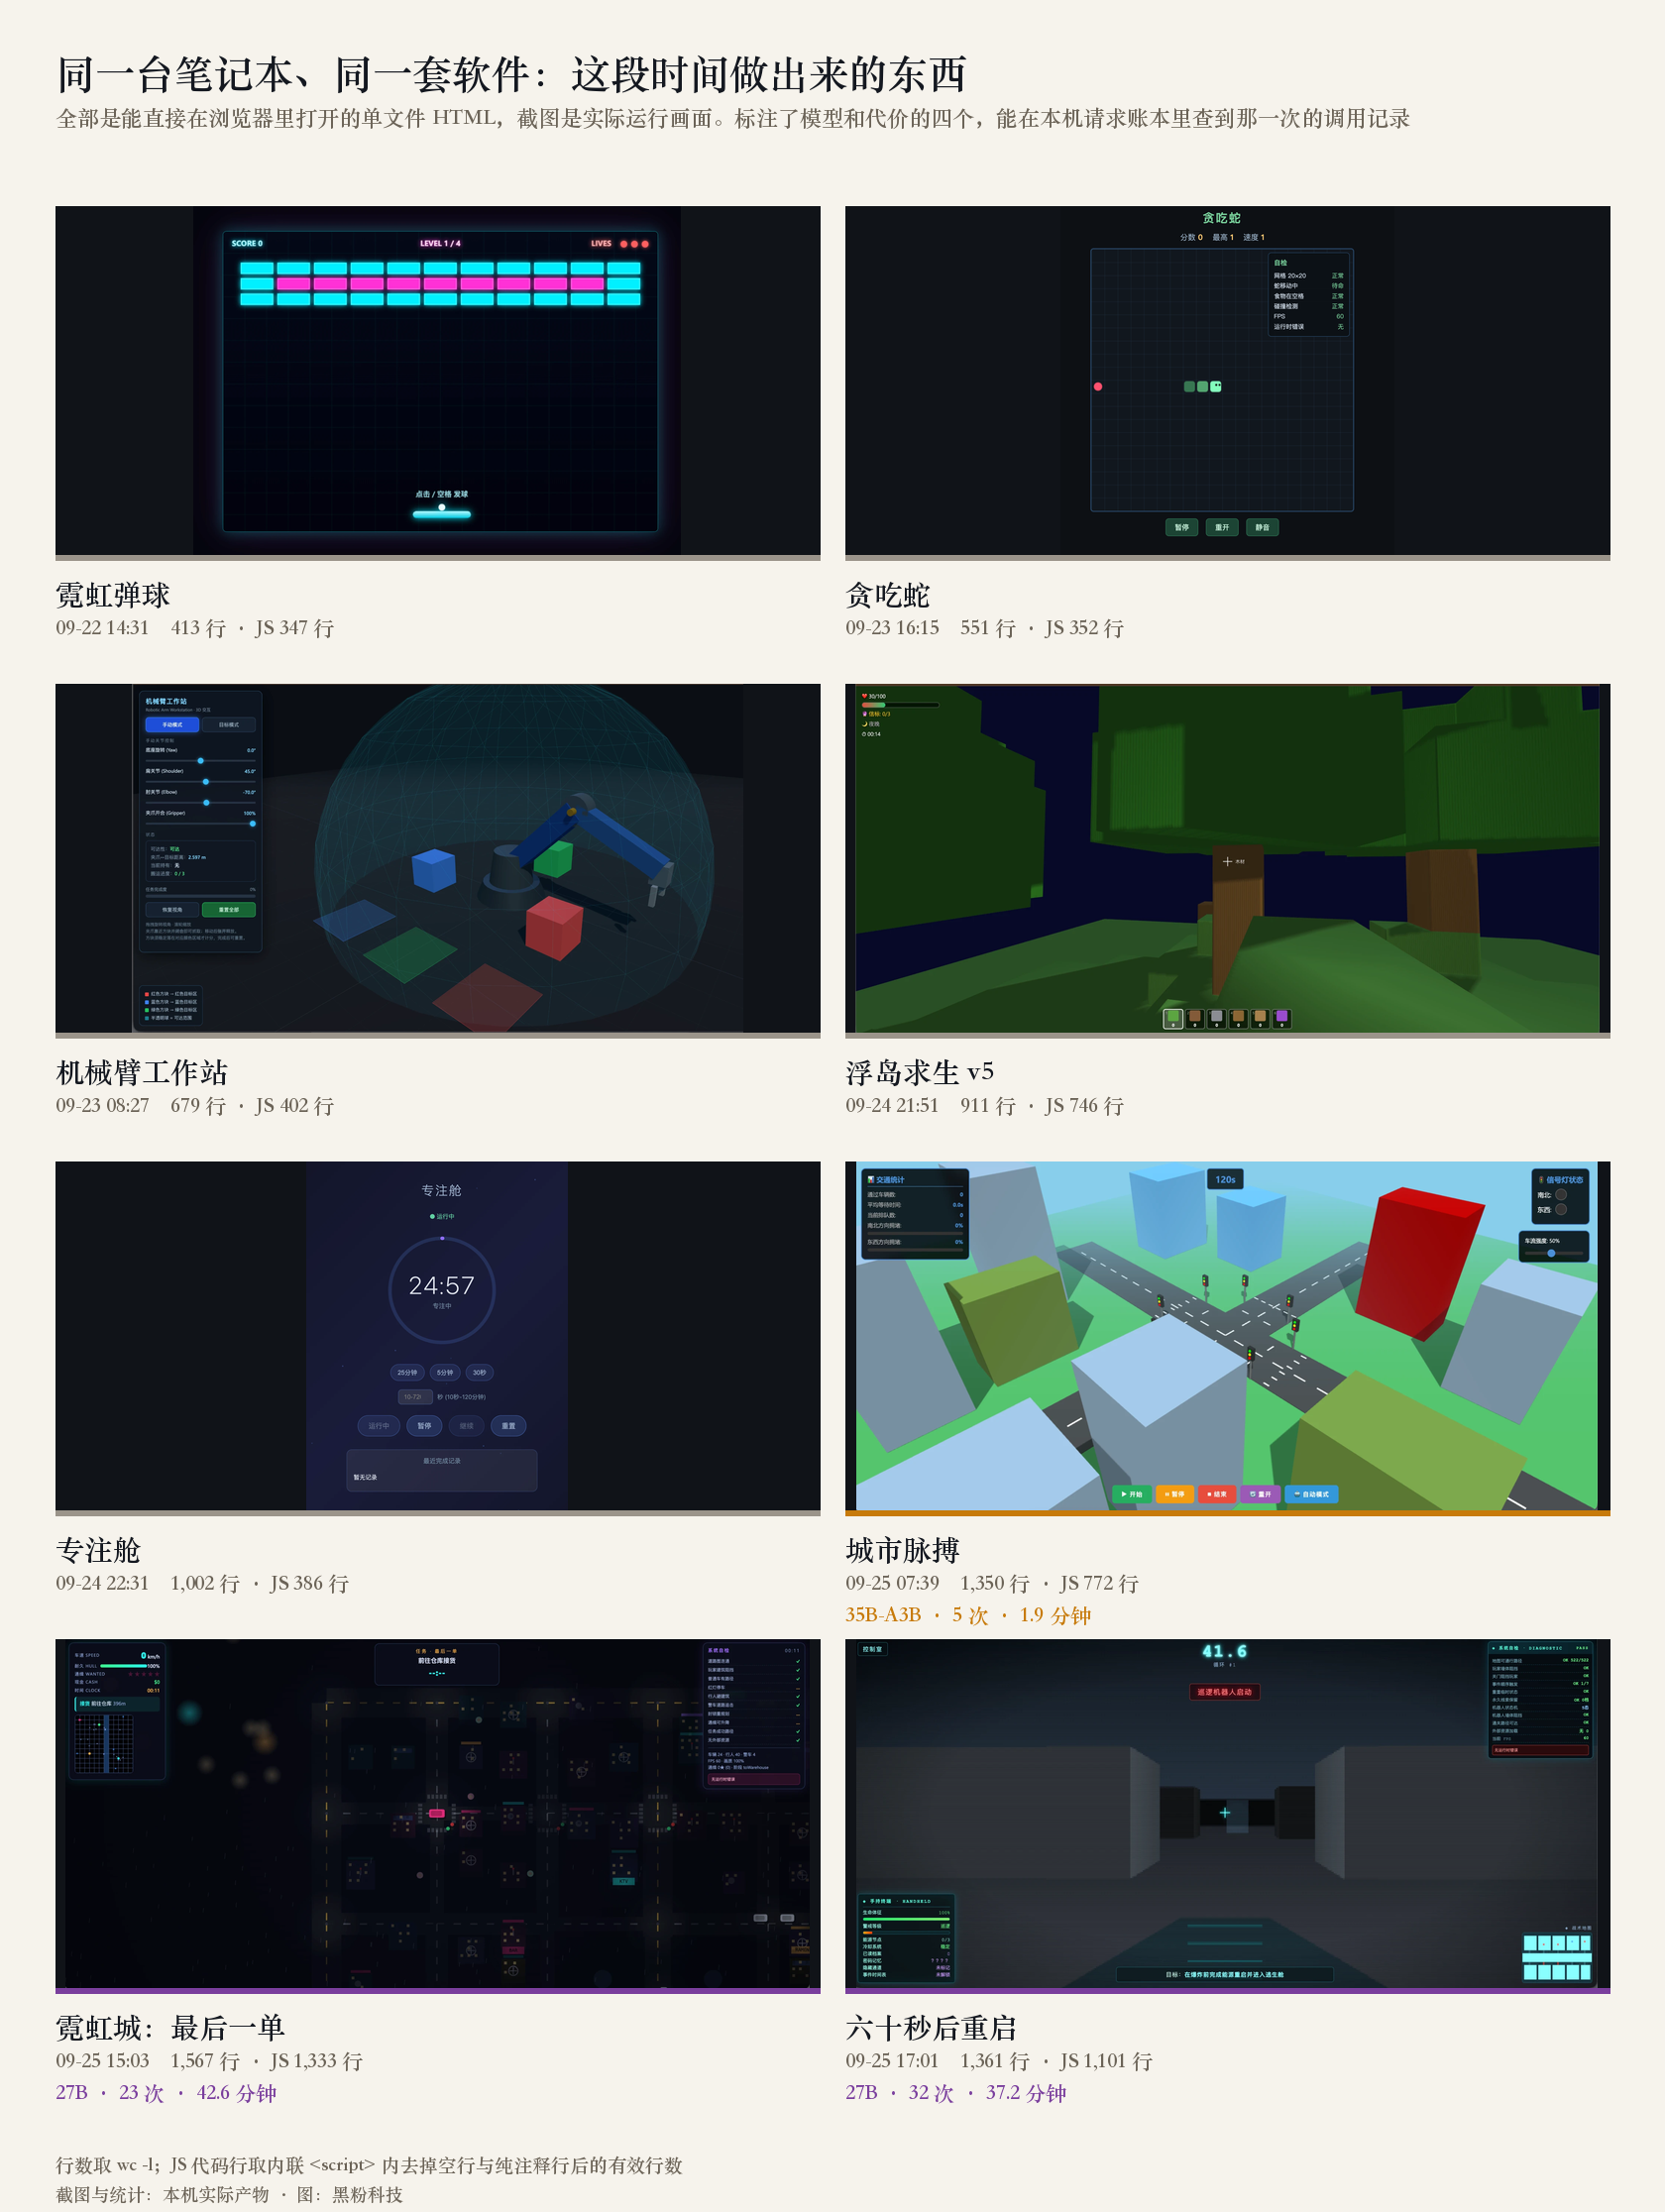
**The archive directory actually contains nine files, but here are only eight screenshots. **The missing one isn’t because I forgot to take a photo—it’s because it doesn’t have any running footage to take. The end of this section will return to it.
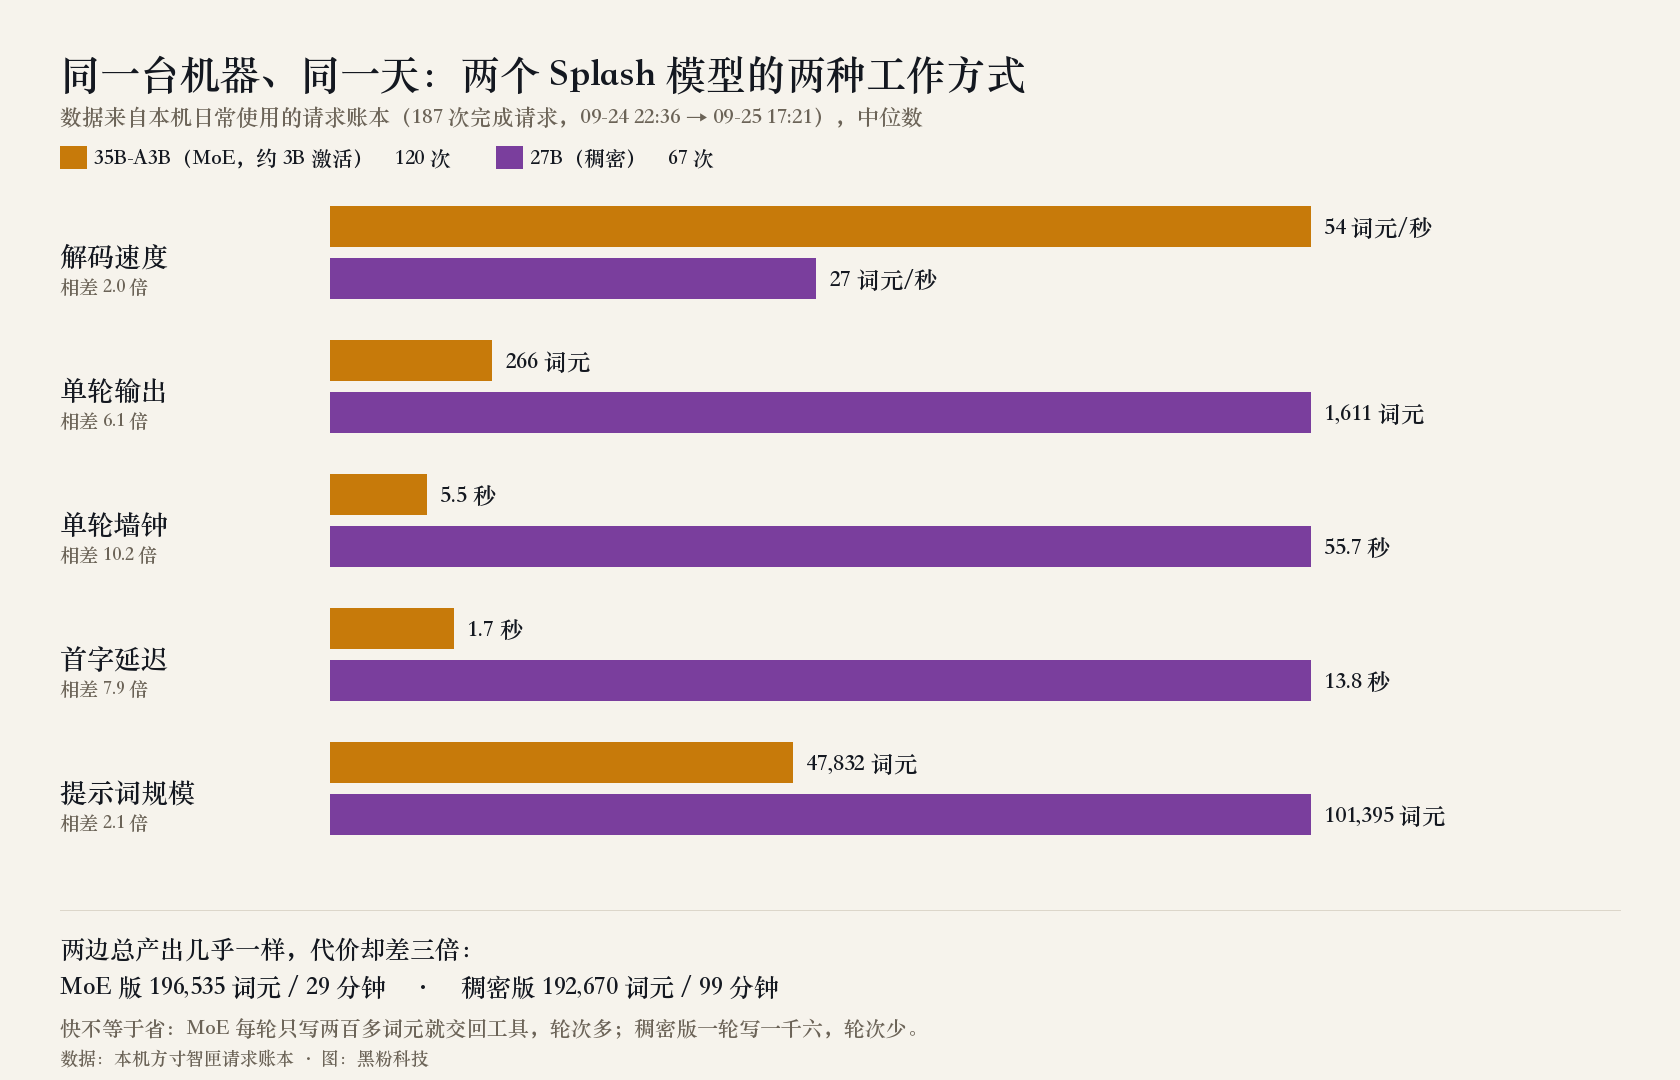
**Both models use Splash, but they work in two different ways. **MoE (35B total parameters, about 3B activation) decodes 54 words per second, writes only 266 words per round, returns the tool in 5.5 seconds, and the first word comes out in 1.7 seconds; Dense 27B decodes 27 words per second, writes 1,611 words per round in 55.7 seconds, and waits 13.8 seconds for the first word. Both sides have almost the same total output (197,000 vs 193,000 words), but the time spent is 29 minutes versus 99 minutes.
There’s another figure worth mentioning: the median prompts for these two models are 48,000 and 101,000 words respectively. This isn’t that I’m writing long articles; it’s that in the proxy cycle, each round has to re-include history and tool results. The previous second layer did the math—reading history is almost free, writing is the total cost; This ledger is physical evidence of that account.
Four finished products, each with its own cost
During the same period, I used it to make four things that could be opened directly in the browser. Aligning the ledger by time window, it was clear how much each finished product spent:
| Finished product | Model | Request number | Generate lexemons | Wall bell | The result |
|---|---|---|---|---|---|
| City Pulse (3D Traffic Simulation) | 35B-A3B | 5 | 15,852 | 1.9 minutes | 1,350 lines / JS 772 lines |
| Neon City: The last order | 27B | 23 | 86,802 | 42.6 minutes | 1,567 lines / JS 1,333 lines |
| Restart in 60 seconds (first-person escape) | 27B | 32 | 72,576 | 37.2 minutes | 1,361 lines / JS 1,101 lines |
| Floating Island Survival (Redo That Time) | 35B-A3B | 36 | 12,794 | 3.9 minutes | 213 lines / JS 0 lines |
The finished product is in ~/Downloads/LocalBrain/System Output/Archive Program/. Line count is taken as
wc -l; JS lines are taken from the inline<script>after removing blank and pure comment lines
**The last line is the main topic of this article. **That time, I ran 36 requests, wrote 12,000 words, spent nearly 4 minutes, and produced 213 lines of HTML: main menu, world seed input box, operation instructions, pause interface, failure screen, flickering — the shell is all included. **And the valid code in the inline script is 0 lines. **

This is not “the model is broken.” The model leaves this sentence on line 208 of the document—// 由于代码量很大,将在后续部分继续—to postpone the work to the next round. Then that cycle ends, and no one asks whether this “follow-up” has been delivered. It’s not that it lacks capability, it’s that no one has caught up with it.
Comparing the same game to the previous night’s version: 911 lines, 746 valid JS lines, 11 onclick spots, 7 addEventListener spots, requestAnimationFrame 5 places. On the empty shell’s side, the last three items are all 0**—not even a single event listener, and the “Start Game” button (id="startBtn") just sits alone in HTML. I actually clicked on it in the headless Chromium: the whole image has only 2,753 pixels discolored (0.17%), positioned exactly in the rectangle where the button itself is, which is the CSS pressed state. The menu doesn’t budge at all.
Warning **By the way, I fell into the trap where mismeasurement can result in reversed, which I stepped into myself. At first, I used the “number of JS functions” as the criterion; the empty shell was 0, which looked very clean—but the City Pulse 3D simulation was that could run, and the
functionkeyword ** was also 0 (it was written entirely with class plus arrow functions). Using that ruler, the ones that could run were listed alongside the empty shell. Switching to “valid code lines in the inline script” separated the two: 0 is correct 772. The granularity of the criterion is incorrect, both good and bad will be reversed—I’ve already failed twice in this article.
Comparing it to the 3D traffic simulation line makes it clearer: **5 requests, 1.9 minutes, 1,350 lines. **The same model, same machine, the only difference is whether the task itself can be controlled.
What exactly is stuck in on-premises deployment: a complete chain from hardware to parameters
The first few sections were repeatedly bumped into. This section sorts them in order—from the hardware you can afford, to whether you can finish writing a file. All the numbers come from local tests (M5 Pro / 64 GB unified memory), with 180 real requests, not factory trademarks or estimates.
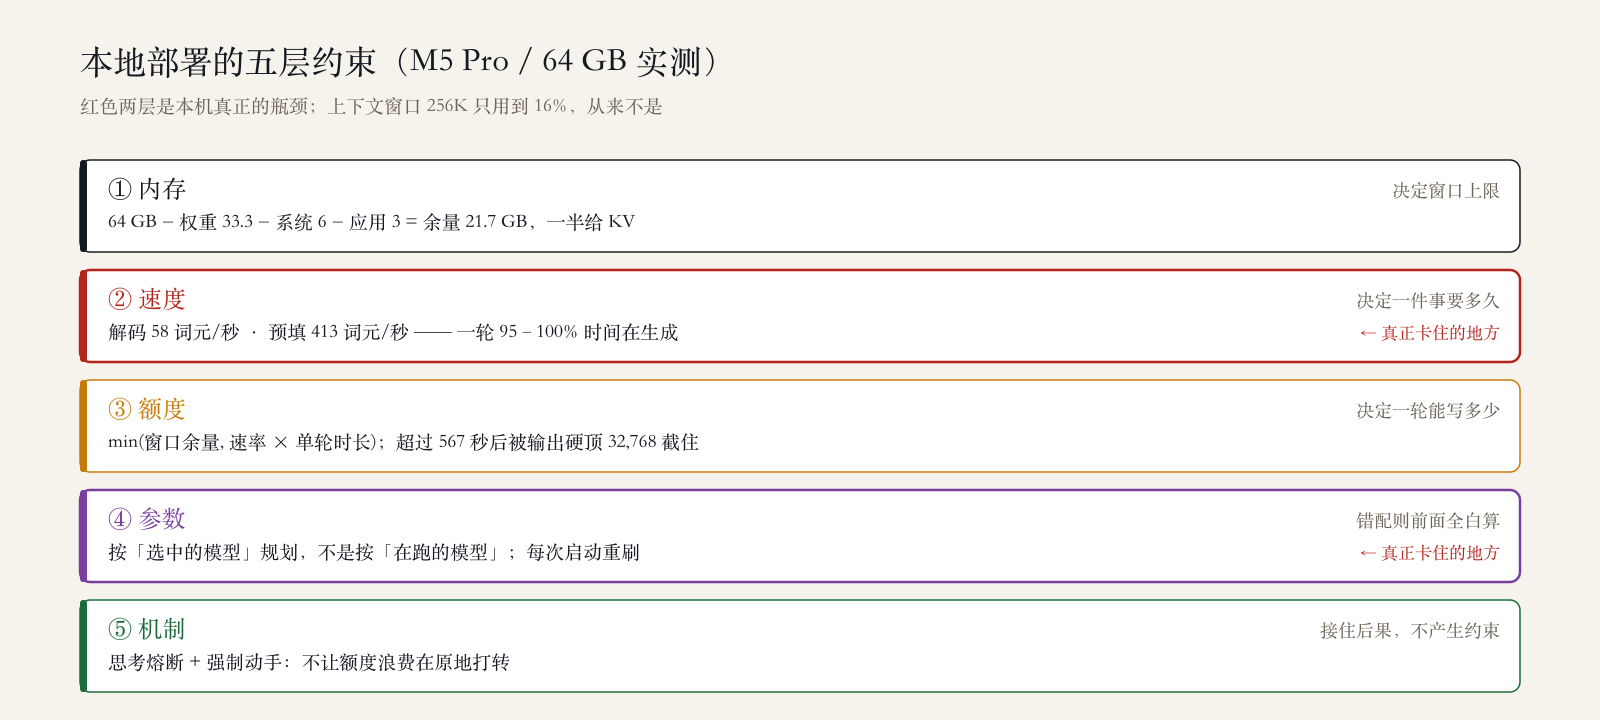
Layer One: Memory determines what you can hold
Unified memory must simultaneously install weights, KV caches, and compute buffers. The revenue sharing method for this software is:
可用余量 = 总内存 − 常驻权重 − 系统预留 − 应用预留
系统预留 = 总内存 × 12%,夹在 3–6 GB
应用预留 = 总内存 × 6%,夹在 1–3 GB
When running 27B (resident 33.3 GB): 64 − 33.3 − 6 − 3 = 21.7 GB.
Of the remainder, only half is allocated to KV cache (the remaining half is reserved for calculation buffer, resident estimation errors, and runtime fluctuations). 10.85 GB, with q8_0 quantization of about 139 KB per word is enough to open a window of 81,920 bytes.
This is a hard constraint, but not the bottleneck of the machine discussed here—because when running Splash, it manages its own memory and directly flies the model with native 256K. Every 25 starts is 256K, and it never scales with memory.
In short: Memory determines the window limit, but the window rarely is the one that truly stucks you.
Layer Two: Speed determines how long a task takes
This is the easiest layer to overlook and hardest to avoid.
| Indicators | Actual measurements are median | Fluctuation range |
|---|---|---|
| Decoding (writing) | 58 Words per Second | 8.7 – 100.9 |
| Prefill (read) | 413 Words per Second | — |
| Cache hit rate | 96% | 20% of requests are lower than 50% |
Put the two numbers together, and the answer is: Prefilling is seven times faster than decoding.
I once thought the cost of long conversations was “rereading history every round.” Breaking down the actual time of one round was directly overturned:
提示词  9,976 · 输出 32,768 → 预填  0.3 秒 + 生成 681 秒   生成占 100%
提示词 34,419 · 输出 32,000 → 预填  3.3 秒 + 生成 944 秒   生成占 100%
提示词  9,899 · 输出 19,866 → 预填 19.2 秒 + 生成 383 秒   生成占  95%
** 95% to 100% of a round is spent on generation. ** Reading history is almost free (especially since 96% hit cache); writing is the real cost.
Hence this unavoidable lower limit: **A single 400-line file page contains about 15,000 words, and generating it takes 260 seconds just to create. ** It’s not “optimized to take thirty seconds,” but physically takes over four minutes.
Third level: The limit is the smaller one in the time and window
How many can be written in each round of the model? Take a minimum value:
本轮额度 = min(窗口还剩多少, 这一轮的时间买得起多少)
时间那一项 = 实测生成速率 × 单轮时长上限
At 58 words per second on the local machine:
| Single round duration | Time quota | It actually happened |
|---|---|---|
| 180 seconds | About 10,400 | If you can’t finish a file, you have to patch it up in subsequent rounds |
| 600 seconds | Approximately 34,800 | Blocked by a hard hit of 32,768 output |
**If it exceeds about 567 seconds (32,768 ÷ 58), the stuck time changes from time to output hardtop. ** So “the longer the round lasts, the better” is wrong—adding more after 600 seconds won’t get a single word.
Actual tests also confirmed: the longest round in the 600-second group took 374 seconds, with 226 seconds left unused; the other five rounds only took 32 to 127 seconds. **By then, time was no longer a constraint. **
Fourth layer: Parameter mismatch—the dumbest and most expensive layer
The above are physics and arithmetic, which can’t be changed but can’t be avoided. This is configuration, and the losses it causes are greater than the sum of the two.
The budget is planned according to the model selected in the interface, not based on the model actually running**. If you select a small 4B model and actually run 27B, the budget is set to 4B: single output 6,144, context 24,576. What’s even more troublesome is that automatic optimization rewrites every time you start, and manual changes to major errors can’t be kept.
The cost is the previous comparison table: same model, same problem, if parameters mismatch, you can’t submit in eleven rounds; After matching, deliver six rounds and pass all self-checks.
Level 5: Mechanism—it does not create constraints; it catches the consequences of constraints
Assign the same model and the same problem to a scheduling framework without convergence mechanisms, give a quota of 32,768, and a time of 843 seconds. The result is zero output: 100,000 bytes of output from start to finish without leaving the inference system.
This article has two more gates—one round with zero output thinking and then interrupting, consecutive no-productive outputs to disable thinking and forcibly call tools—the same model delivers 400 lines and passes all 12 interaction checks.
**The mechanism does not make the model stronger; it only ensures the model does not waste the quota on idle loops. **
Summary: What can be adjusted, and which is useless
| Restraint | Actual measured values on this device | Adjustability |
|---|---|---|
| Unified total memory | 64 GB | Change the machine |
| He held significant authority as a permanent resident | 27B takes up 33.3 GB | Change the model |
| Context window | Splash always gives a fixed 256K cap | Not adjustable, and not needed (actually used up to 16%) |
| Generation speed | 58 words per second | Switching to a smaller model; Or verifying the true gain of inferred decoding |
| Single round duration | 600 seconds | Adjustable, but invalid for more than 567 seconds |
| Single output hard hit | 32,768 | Adjustable, but the machine is not fully used |
| The selected model matches the actual run | —— | Must be consistent, otherwise the previous pitch is all white |
| Close the sluice gate | Default is fully enabled | It is recommended not to move |
If you can only remember one thing: **First, confirm that the model you selected on the interface is the one you’re actually running. ** If this one is wrong, every subsequent adjustment will be erased by the next startup.
Who profits from this, and whoever loses it
Who benefits: hardware sellers. The phrase “switch to a bigger model” can be directly translated as memory requirements. There are also cloud services billed by call volume—if local runs don’t run smoothly, users naturally return to the cloud.
Who Loses: User time. For the same snake, turning off two switches takes 16 extra minutes; And the time cost of parameter tuning itself is even greater, mostly spent on noise discrimination. This money doesn’t go to anyone’s account—it’s just a waste of time.
Who’s Silent: The model publisher has no motivation to tell you “this model needs an external convergence mechanism to be effective,” which sounds like the model isn’t good enough. So the public leaderboard is full of single-round ability scores, with almost no “multi-round task completion rate” or “average number of rounds needed to complete a task.” The silent side’s stance is the conclusion: the shape of the ranking determines what everyone optimizes.
This also explains why manufacturers prefer to disclose decoding speed rather than completion rate. On September 20, I had a collision: the three-value quantization 27B decoded 2~3 times faster, passed all four atomic probe tests, but the real long task was delayed and couldn’t be delivered; The same Q8 27B was delivered in 31 minutes. **Speed is easy to measure, completion rate is hard to measure, so only speed is tested. **
Back to those 64 minutes
The progress bar at the beginning now stops after 120 seconds of silence and clearly states, “This connection no longer generates data, neither the quota nor the time.” This is the part I’m most satisfied with this round of changes—not because it’s complicated, but because it restores a phenomenon that “looks like a slow model” back to its original state.
Three paths for those who want to get started:
Just Want to Run Smoothly: Two switches remain on by default, do not touch the value threshold, and leave a single round duration of 180 seconds. Qwen3.8-27B-Splash can deliver all four build questions on Apple Silicons above 32GB.
Want to adjust parameters: First, measure your own machine’s noise. Run the same problem with the same set of parameters three times and note down the span. Don’t take differences smaller than this span as conclusions.
Troubleshooting: When stuck, first check if the flow is silent—if the server log says Done but the interface is still running, this is the issue, unrelated to the model.
I myself am caught up in that silence. Before writing this, I always thought the problem with this gate was that the threshold wasn’t set well enough. After checking each item, I realized the real problem never really lies in the threshold.
🧰 Tools I build
I maintain all of these tools myself. Preview builds are clearly labeled; the release pages are the source of truth for downloads, updates and known limits.
Info: HyphenBox Status: Official releases
A radar for free LLM APIs: availability is re-tested continuously, one local interface for all of them, and keys stay on your machine
Info: LocalBrain Status: Official releases
A multimodal MCP toolbox for local models: TTS, Whisper and video generation in one place
Info: ScreenLex Status: Official releases
Learn new words while you watch shows. Free, for Mac and Windows
Info: HyphenScreen Status: Official releases
Screen recording and smart editing in one: a DaVinci-style timeline, automatic redaction and a check of the finished video before export. Free
Quote: HyphenTech Make AI your superpower Local deployment · Free resources · Self-made software https://hyphentech.top
Late nights and burned API credits went in,a cup of tea comes back out — only if you feel like it.
Scan with WeChatPress and hold to save the image, then open it from your album in WeChat Scan

Comments
Loading comments…